| Project Name | Mori |
| Street | Guillemard Road |
| District | 14 - Eunos, Geylang, Kembangan, Paya Lebar , Sims |
| Market Segment | RCR - Rest of Central Region |
| Lease | Freehold |
| Age | Freehold Years |

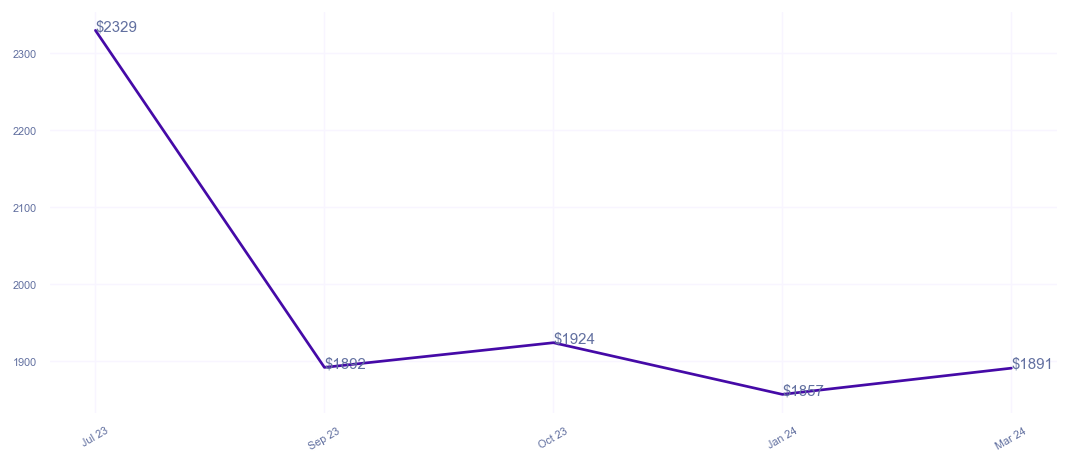
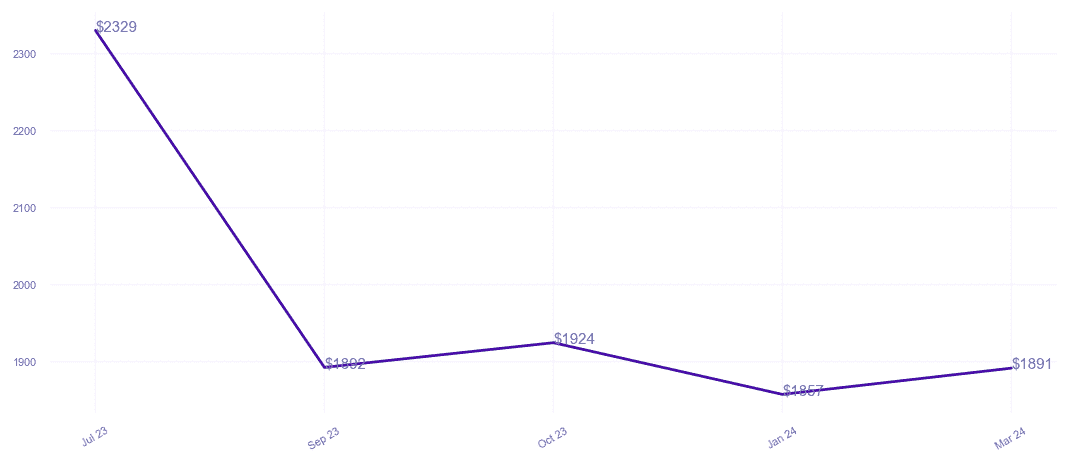
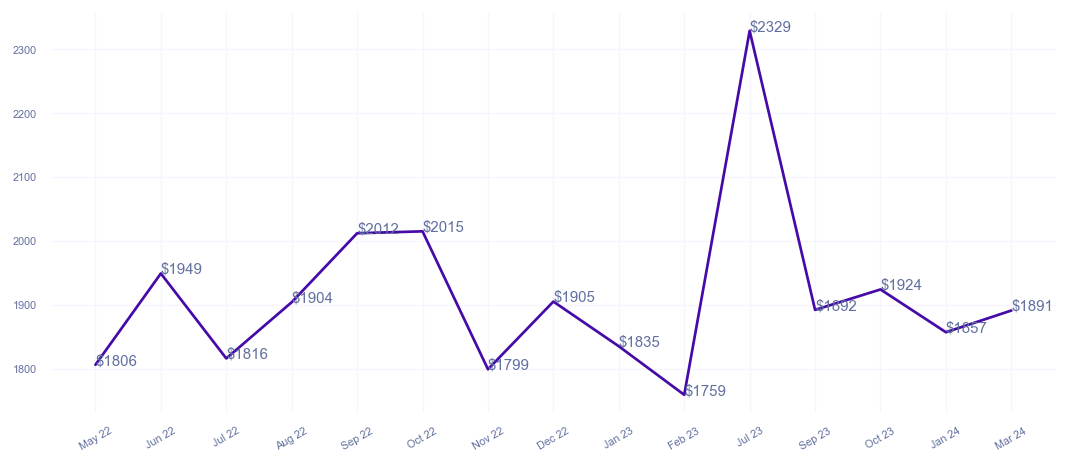
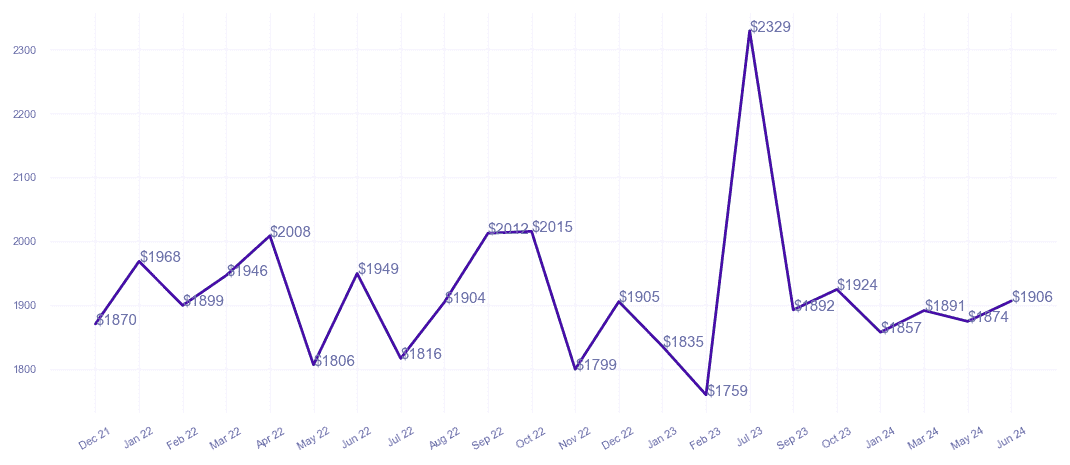
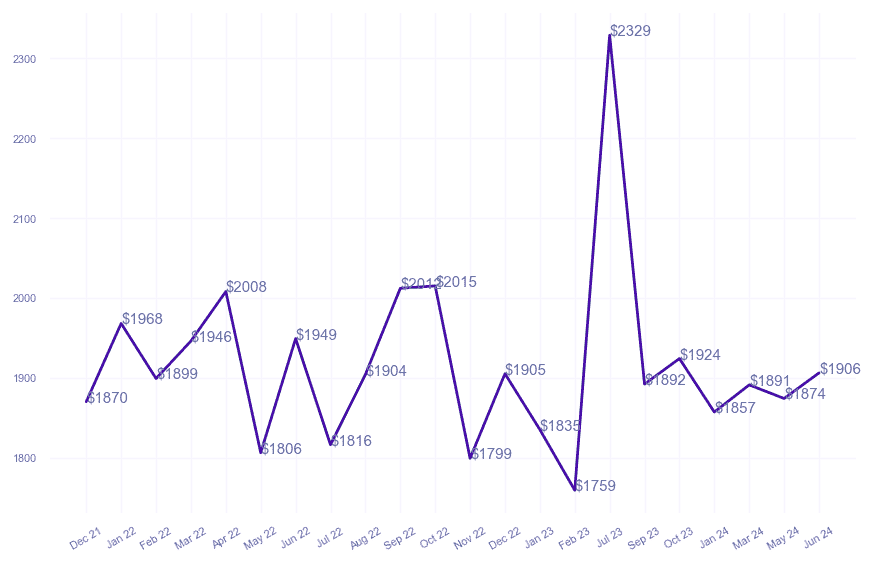
PSF Price
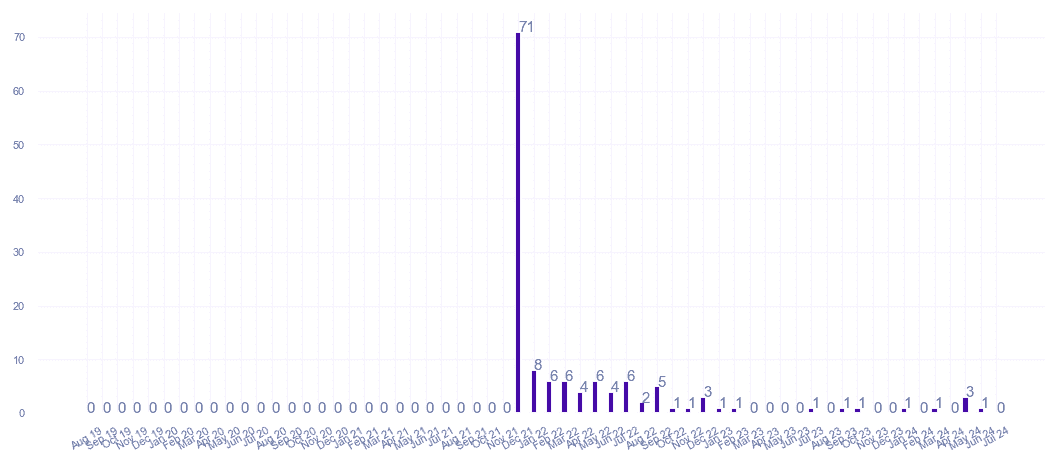
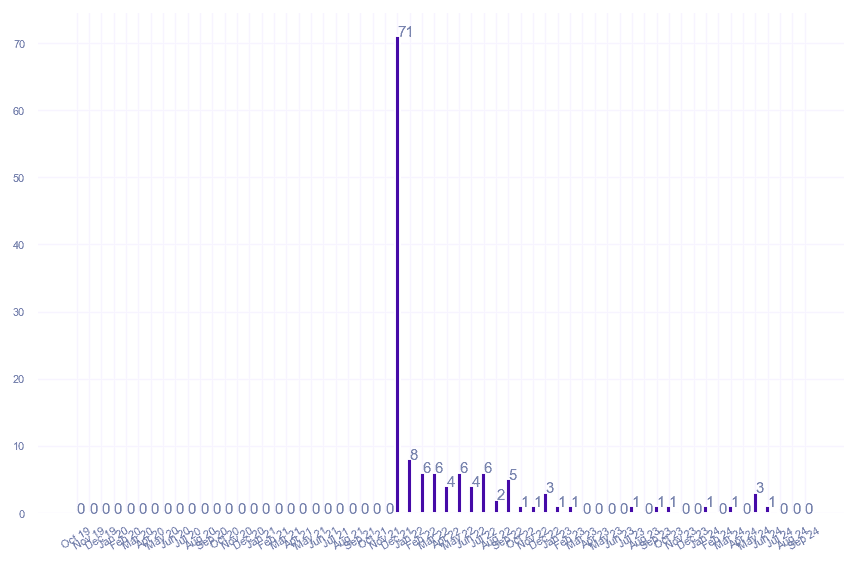
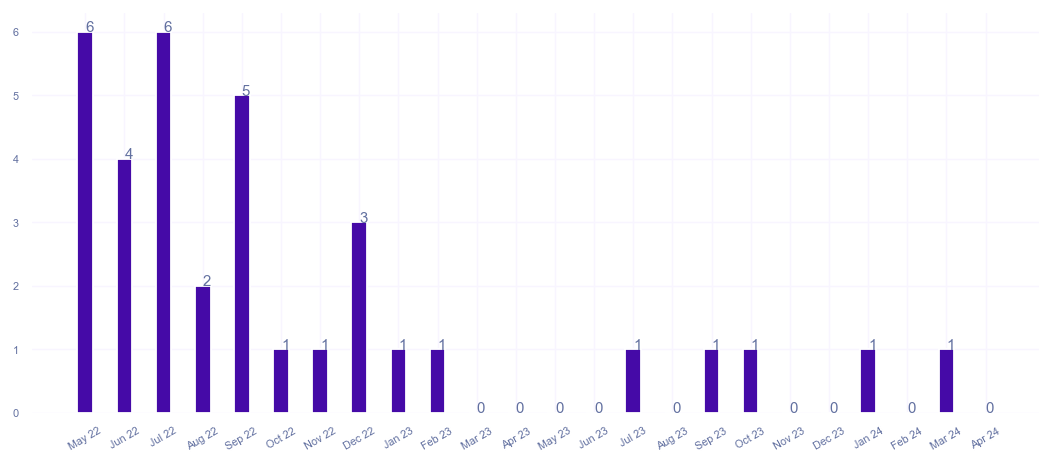
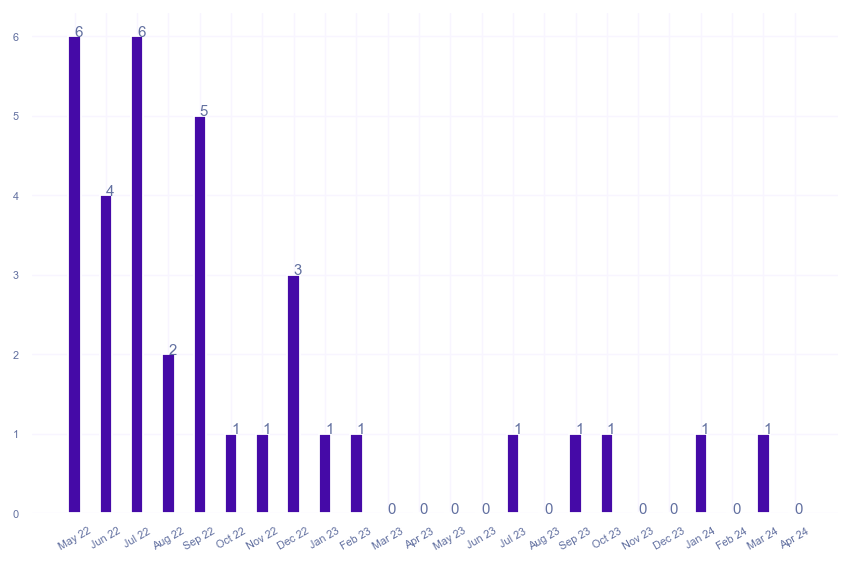
Transactions
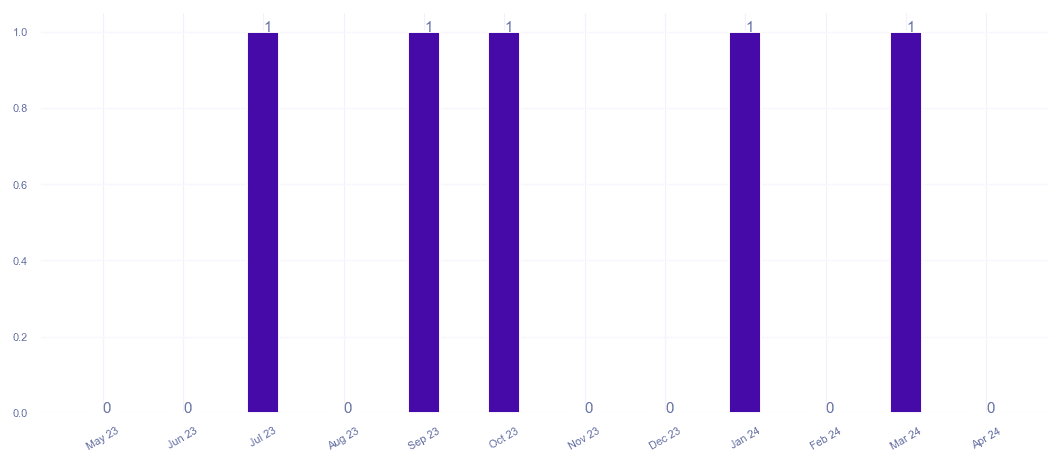
| Unit Price | Size | Date | |
|---|---|---|---|
| $1,300,000 $1,831 psf | 710 sqft | Sep 25 | |
| Project Name | Mori |
| Street | Guillemard Road |
| District | 14 - Eunos, Geylang, Kembangan, Paya Lebar , Sims |
| Market Segment | RCR - Rest of Central Region |
| Lease | Freehold |
| Age | Freehold Years |
PSF Price
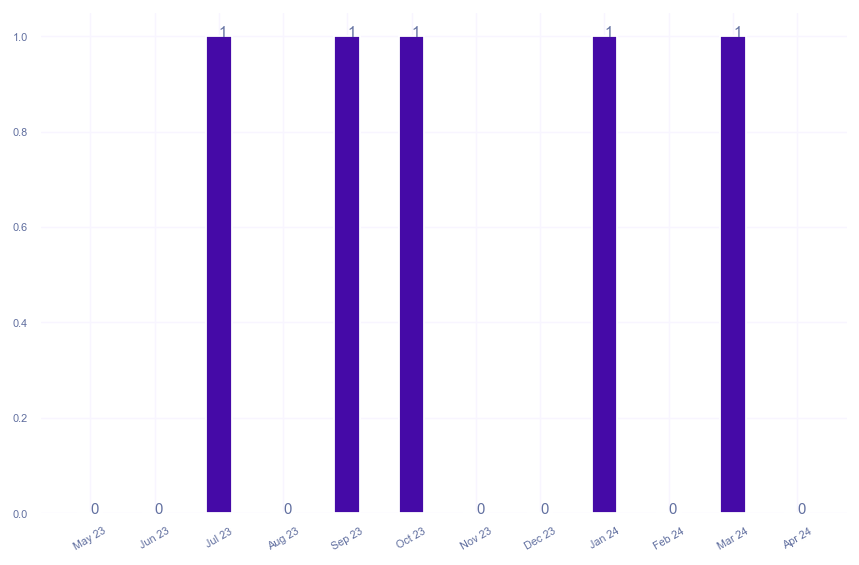
Transactions
| Unit Price | Size | Date | |
|---|---|---|---|
| $1,300,000 $1,831 psf | 710 sqft | Sep 25 | |
| $1,370,000 $1,930 psf | 710 sqft | Apr 25 | |
| $2,111,000 $1,800 psf | 1173 sqft | Dec 24 | |
| $2,125,000 $1,812 psf | 1173 sqft | Dec 24 | |
| $2,082,500 $1,775 psf | 1173 sqft | Dec 24 | |
| $2,236,000 $1,906 psf | 1173 sqft | Jun 24 | |
| $2,155,712 $1,963 psf | 1098 sqft | May 24 | |
| $2,359,000 $1,874 psf | 1259 sqft | May 24 | |
| $2,080,000 $1,757 psf | 1184 sqft | May 24 | |
| Project Name | Mori |
| Street | Guillemard Road |
| District | 14 - Eunos, Geylang, Kembangan, Paya Lebar , Sims |
| Market Segment | RCR - Rest of Central Region |
| Lease | Freehold |
| Age | Freehold Years |

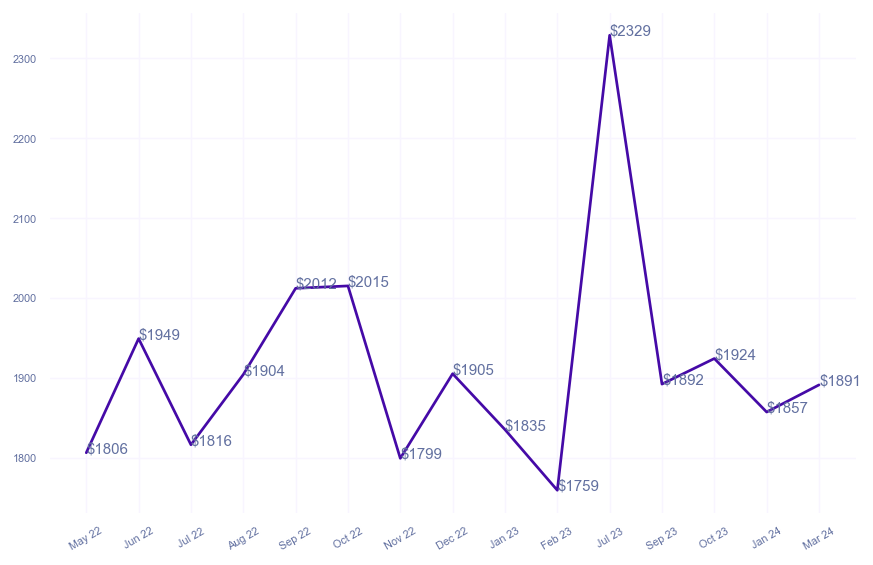
PSF Price
Transactions